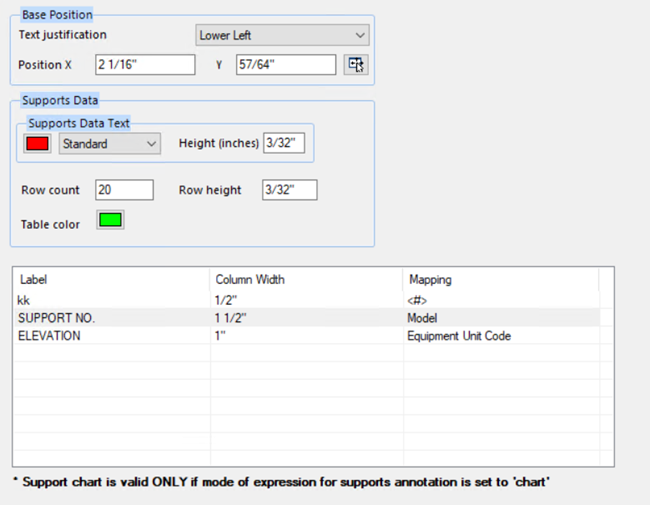
The Support Chart page lets you to define parameters for
the support chart such as Base Position, Column width, Column Height as well as
information on the text which populates the chart.
Accessed by selecting the
Lists and Reports > Supports node in the
Settings interface.
The Support Chart is used to list support information for
the drawing. When the Support Chart is used, each support in the drawing is
annotated with a number, which corresponds to a record in the chart providing
information (tag number, elevation) for the support.
Note: Please note the
Support chart is used only when the Mode of Express field in the Annotations
>
Instruments and Supports options page is set to Chart.
Define the properties per the fields described below and
Save the changes.
The Close icon closes the Project Settings interface, so
make sure your changes are saved. You will be prompted to save them it you
haven't already.
The Load Defaults icon in the main
Settings interface will return the settings of the options
page to their original values.
| Setting | Description |
|---|
| Base Position
|
-
Text Justification: This option
determines the base point from which the Support Chart is placed in the
drawing. Select from Upper Left, Lower Left, Upper Right or Lower Right.
-
Position: You can opt to enter an
exact position directly in the Position X and Position Y fields or click the
 icon to the right of the fields
to pick the position in the drawing. icon to the right of the fields
to pick the position in the drawing.
|
| Supports Data
|
In this section define the properties for the
support data text and the support chart.
-
Color: Click the icon and select a
color from Color Table for the label text.
-
Text Type: Select a text type for the
label from the drop down list. You can click the "..." option at the bottom of
the list to display the Microstation Text Styles dialog allowing you to modify
the text styles if desired.
-
Text Height: Enter a text height
dimension into the field provided.
-
Row Count: Enter a maximum number of rows for the chart.
-
Row Height: Enter a height for the chart rows.
-
Chart color: Click the icon and
select a color from the Color table to define the color of the chart grid
lines.
|
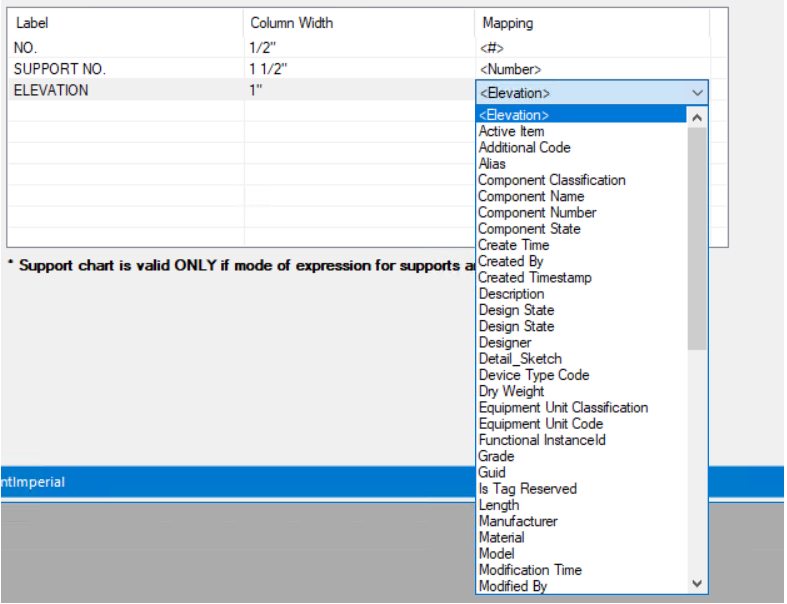
| Label , Column Width and Mapping
|
Use these fields to define the width of the columns
in the Support Chart. Now Labels can also be changed as per choice.
The mapping column lets you select a property to
display:
|